There is a number buried in the financial statements of every major automaker that tells you more about the future of the car business than any sales forecast, EV roadmap, or earnings guidance ever could. It is the warranty accrual line—the amount the company sets aside, each quarter, to pay for the things it already knows are going to break.
In 2024, that number reached a scale that is impossible to ignore. Ford Motor Company paid $5.83 billion in warranty claims—more than any other U.S. automaker, and 22% more than the year before. General Motors paid $4.47 billion, up 12%. Tesla paid $1.45 billion, up 19%. Those three companies alone spent $11.75 billion fixing vehicles that should have worked when they left the factory (Warranty Week, 2024 Annual Report).
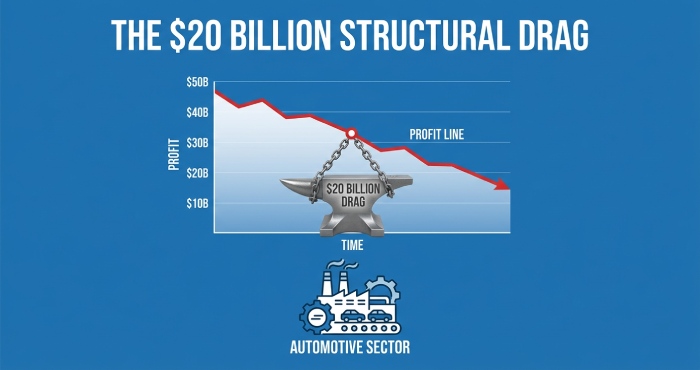
Add Stellantis—whose warranty costs are disclosed under IFRS rather than U.S. GAAP but whose 2024 annual report reveals a company in crisis with net revenues down 17% and net profit down 70%—along with Hyundai, Kia, Toyota, Honda, Nissan, and every other manufacturer selling vehicles in the United States, and the industry’s total warranty expenditure in 2024 almost certainly exceeded $20 billion.
That is not a rounding error. It is not an accounting curiosity. It is a structural cost that is actively reshaping how cars are designed, manufactured, priced, and sold. It is changing executive compensation, driving legislative reform, flooding courts with litigation, and forcing manufacturers to make hard choices about which vehicles to build and which to cancel.
This article follows the money—from SEC filings to factory floors to courtrooms—to show how warranty defects have become the auto industry’s most expensive and least discussed problem.
The Numbers: What the SEC Filings Actually Show
Every publicly traded automaker is required to disclose warranty costs in its SEC filings. These are not estimates or projections—they are audited financial figures reported to the Securities and Exchange Commission under penalty of law. Warranty Week, the only publication that systematically aggregates and analyzes these disclosures across manufacturers, published its 2024 annual report in February 2025. The data is stark:
| Manufacturer | 2023 Claims | 2024 Claims | YoY Change | Claims Rate (2024) |
| Ford | $4.78B | $5.83B | +22% | ~3.5% |
| GM | $4.01B | $4.47B | +12% | ~2.5% |
| Tesla | $1.23B | $1.45B | +19% | ~1.5% |
| Combined | $10.02B | $11.75B | +17% | — |
Source: Warranty Week analysis of SEC 10-K filings. Claims rate = warranty claims paid as a percentage of automotive revenue.
Ford’s claims rate of approximately 3.5% is the highest of any major U.S. automaker. To put that in context: for every $100 of vehicle revenue Ford generates, $3.50 goes directly to fixing things that broke under warranty. On a $50,000 F-150, that translates to roughly $1,750 per truck in expected warranty costs—money that comes directly out of Ford’s margin.
The quarterly trajectory tells an even more revealing story. Ford’s warranty claims rose 42% from the first half of 2023 to the first half of 2024, with the largest single-quarter jump being a 44% increase from Q2 to Q3 2023 (Warranty Week, Mid-Year 2024 Report). Since that inflection point, claims have stabilized at roughly $1.4–1.5 billion per quarter—but they have not declined. The bleeding has stopped accelerating, but it has not stopped.
GM’s trajectory is arguably more concerning because it is accelerating. In 2024, GM’s warranty claims moved from $1.02 billion in Q1 to $1.27 billion in Q4—a 25% increase within a single fiscal year. Unlike Ford, whose quarterly costs have plateaued, GM’s are climbing.
Tesla’s $1.45 billion is the smallest of the three but growing the fastest in percentage terms. Q4 2024 claims ($405 million) were 23% higher than Q1 ($328 million). This reflects two dynamics: Tesla’s fleet is aging (more vehicles entering their third and fourth years of ownership, when warranty claims historically peak), and Tesla’s production volume continues to grow, expanding the denominator of vehicles under warranty coverage.
Ford: The Company That Would Have Set Records Without Warranty Costs
Ford’s warranty problem is not a secret. It is the most discussed line item in the company’s earnings calls, the most written-about topic in automotive trade press, and the single biggest drag on what would otherwise be record-breaking profitability.
On Ford’s Q3 2024 earnings call, CFO John Lawler was asked directly when warranty costs would start to come down. His answer was remarkably candid: “I just can’t tell you when that curve is going to bend” (WardsAuto). Ford had projected $10–12 billion in adjusted profit for 2024. It landed at $10 billion—the low end—and executives explicitly attributed the shortfall to warranty costs.
Ford’s 2024 10-K filing reveals the accounting methodology: “We accrue obligations for warranty costs at the time of sale using a patterned estimation model that includes historical information regarding the nature, frequency, and average cost of claims for each vehicle line by model year.” This means Ford bakes expected warranty costs into the price of every vehicle it sells. When actual claims exceed the estimate—as they have for the past two years—the company must record additional “changes of estimate” that directly reduce reported earnings.

The 10-K also discloses that Ford is “currently a defendant in a significant number of litigation matters relating to the performance of vehicles, including those equipped with DPS6 transmissions.” The DPS6 dual-clutch transmission, used in the Ford Focus and Fiesta from 2011 to 2018, has been the subject of tens of thousands of lemon law claims and a major class action settlement. It is a case study in how a single component defect can create a multi-billion-dollar liability.
What This Means for Ford’s Strategy
Ford’s response has been structural, not cosmetic. CEO Jim Farley has repeatedly acknowledged a $7 billion cost gap with competitors and has reorganized the company into three distinct business units—Ford Blue (ICE/hybrid), Ford Model e (EVs), and Ford Pro (commercial)—in part to isolate and address quality problems within each segment. The 2024 10-K shows Ford Model e lost over $5 billion in 2023 and continued to lose money in 2024, making it particularly sensitive to warranty cost overruns.
For investors, the implication is that Ford’s margin expansion narrative depends almost entirely on warranty cost reduction. Every $500 million improvement in warranty costs flows directly to the bottom line. Ford has invested in supplier quality programs, increased pre-delivery inspection protocols, and restructured its engineering validation processes. But the results have been slow to materialize, and Lawler’s admission that he “can’t tell you when that curve is going to bend” suggests management itself does not have visibility into the inflection point.
GM: Accelerating Costs and the Bolt Battery Legacy
General Motors’ $4.47 billion in 2024 warranty claims is overshadowed in headlines by Ford’s larger figure, but GM’s trajectory is in some ways more alarming. Ford’s costs have plateaued; GM’s are climbing quarter over quarter. The Q4 2024 figure of $1.27 billion was the company’s highest quarterly warranty cost on record (Warranty Week).
GM also carries a unique legacy cost that illustrates the extreme financial risk of EV battery defects. The company’s Q1 2024 10-Q filing disclosed a remaining accrual of $0.5 billion for the Chevrolet Bolt EV/EUV battery recall. This recall—which required replacing battery modules in approximately 142,000 vehicles due to a fire risk traced to manufacturing defects at LG Energy Solution’s battery cell plant—is one of the most expensive single-component recalls in automotive history. The total cost to GM exceeded $2 billion, and the company negotiated a $1.9 billion recovery from LG.
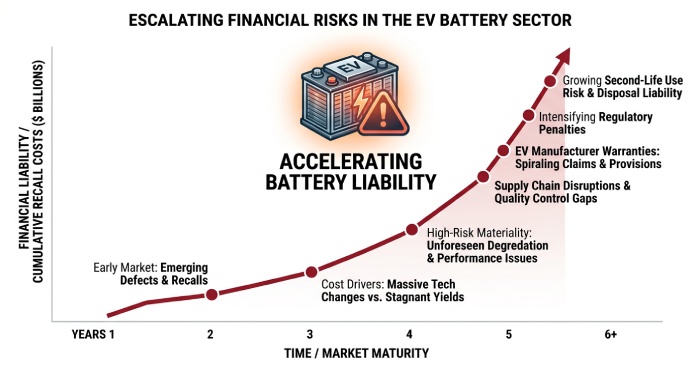
The Bolt recall is a cautionary tale for the entire industry. A single defect in a single component from a single supplier created a multi-billion-dollar liability, required a full production halt, and took nearly two years to resolve. As EV battery packs become the most expensive single component in a vehicle—often representing 30–40% of total vehicle cost—the financial exposure from battery-related warranty claims dwarfs anything the industry has seen with traditional powertrain defects.
The Lemon Law Connection
GM’s warranty costs are not just an accounting problem. They are a litigation problem. The CALPIRG Auto Lemon Index—a 2022 nonprofit research report analyzing California court filings—found that GM was sued under the Lemon Law once for every 78 new vehicles registered in California, compared to Toyota at 1 per 2,029. GM buyers were 26 times more likely to file a lemon lawsuit than Toyota buyers, and GM alone accounted for nearly one-third of all California lemon law cases from 2018 to 2021.
Every one of those lawsuits represents not just a warranty claim, but a legal settlement or judgment that includes attorney fees (paid by the manufacturer under California’s one-way fee-shifting provision), civil penalties of up to 2x actual damages for willful violations, and the reputational damage of a court finding that the manufacturer sold a defective vehicle and could not fix it. The legal costs layer on top of the direct warranty costs disclosed in the 10-K, making the true cost of quality failure significantly higher than the SEC filings suggest.
Tesla: The OTA Paradox
Tesla presents a paradox in the warranty cost landscape. The company paid $1.45 billion in warranty claims in 2024—the lowest of the Big Three U.S. automakers—yet it led all manufacturers in total recalled vehicles with 5.1 million units (NHTSA 2024 Annual Report on Safety Recalls). How can a company recall the most vehicles and spend the least on warranty?
The answer is over-the-air (OTA) software updates. A significant share of Tesla’s recalls are remedied through software patches pushed remotely to vehicles, requiring no dealership visit, no parts, and minimal labor cost. The NHTSA annual report shows Tesla leading all manufacturers in OTA-remedied recalls. This capability fundamentally changes the cost structure of a recall: instead of shipping parts to thousands of dealerships and paying technicians for physical repairs, Tesla deploys code.
But OTA updates do not fix hardware. Tesla’s 2024 10-K states that the company provides “a manufacturer’s limited warranty on all new and used Tesla vehicles we sell, which may include separate limited warranties on certain components, specific types of damage or battery capacity retention.” Battery, motor, and structural defects still require physical repairs, and as Tesla’s fleet ages, these claims are growing. Q4 2024 claims of $405 million were 23% higher than Q1’s $328 million—a steady quarterly climb that mirrors the fleet’s aging profile.

What this means for the EV industry: Tesla’s OTA capability is a genuine competitive advantage in warranty cost management, but it has limits. The broader EV industry—which does not have Tesla’s software architecture or OTA infrastructure—faces warranty cost exposure that is qualitatively different from the ICE world. The NHTSA report shows EV-specific component recalls jumped from 12 in 2020 to 74 in 2024, covering 2.9 million vehicles. Battery recalls are orders of magnitude more expensive than traditional powertrain recalls, and the industry is still in the early innings of understanding long-term EV reliability.
Stellantis: When Quality Failures Become an Existential Threat
If Ford’s warranty problem is a margin drag and GM’s is an accelerating liability, Stellantis’s is approaching existential territory. The company’s 2024 annual report shows net revenues down 17% to €156.9 billion, net profit down 70% to €5.5 billion, and industrial free cash flows of negative €6.0 billion. The company cited “operational difficulties and disruptions associated with transitioning to our next generation of products”—corporate language for quality problems severe enough to disrupt production and sales.
Perhaps the most revealing document in the Stellantis portfolio is its 2024 Remuneration Report—the corporate governance filing that details how executives are paid. This document reveals that Stellantis ties executive compensation directly to “Total Warranty Cost” and “Warranty Incidents” as performance metrics. In 2024, the company’s Short-term Annual Incentive Plan (SAIP) required positive free cash flow as a trigger condition. Because industrial free cash flows were negative €6 billion, the CEO and executive leadership received zero SAIP payout.
Warranty costs at Stellantis are now severe enough to eliminate executive bonus payouts entirely. When defect rates cost a CEO their bonus, you can be certain the issue has reached the boardroom.
On the recall front, Chrysler (Stellantis) issued 72 recall orders in 2024—more than any other manufacturer (NHTSA 2024 Annual Report). Between 2010 and 2024, Chrysler accumulated 545 recalls, second only to Ford’s 569. CEO Carlos Tavares resigned in December 2024, and the company initiated a search for his replacement—a leadership transition driven in significant part by the operational failures documented in these filings.
The Hidden Multiplier: Litigation, Lemon Laws, and the Costs That Don’t Show Up in the 10-K
SEC-disclosed warranty costs represent only the direct cost of parts and labor for covered repairs. They do not include the downstream costs that warranty defects generate: lemon law settlements, class action litigation, recall administration, regulatory compliance, reputational damage, and lost customer lifetime value. These downstream costs can double or triple the true cost of a defect.
California’s lemon law system provides a window into the scale of this litigation burden. According to the California Assembly Judiciary Committee’s analysis of AB 1755—a government PDF—lemon law case filings nearly doubled from 14,892 in 2022 to 22,655 in 2023. By 2024, filings exceeded 25,000 and were projected to surpass 30,000. Nearly 10% of all civil filings in Los Angeles County are now lemon law cases.
Each of those cases represents a vehicle that required multiple failed repair attempts before the consumer pursued legal action. Under California’s Song-Beverly Act, manufacturers who lose must pay the full buyback price (minus a mileage offset), all collateral charges and incidental damages, the consumer’s attorney fees, and potentially a civil penalty of up to 2x actual damages for willful violations. A single lemon law case can cost a manufacturer $50,000 to $150,000 in total exposure—far more than the warranty repair costs that triggered it.
Multiply that by tens of thousands of cases per year, in California alone, and the downstream litigation cost for the Big Four manufacturers (GM, Ford, Stellantis, and Nissan, which account for over 70% of all California lemon law cases) likely runs into the billions annually. These costs are buried in “legal proceedings” and “contingency” disclosures in the 10-K, not in the warranty line item, making them difficult to aggregate.
The Recall Completion Gap: 31% of Defective Vehicles Never Get Fixed
Even when manufacturers acknowledge a defect and issue a recall, the problem frequently goes unresolved. The NHTSA’s 2024 Annual Recalls Report shows that the average vehicle recall completion rate was approximately 69% across 2020–2023. That means 31% of recalled vehicles—millions of cars on U.S. roads—have known safety defects that have never been repaired.
The NHTSA’s January 2025 Recall Completion Rates Report provides additional context: in 2023, the agency processed over 1,000 new recalls covering more than 39 million vehicles and items of motor vehicle equipment. The sheer volume of recalls—more than 1,000 per year—means that even a 69% completion rate leaves tens of millions of vehicles unrepaired.
Every unrepaired vehicle is a rolling warranty liability. When that vehicle eventually comes in for service—or when the owner files a lemon law claim because the manufacturer never fixed the recalled defect—the cost materializes. The recall completion gap is, in effect, a deferred warranty cost that manufacturers are carrying on their books as an unreported contingent liability.
What This Means: Five Structural Consequences
1. Vehicle Prices Will Continue to Rise
Warranty costs are baked into vehicle pricing through the accrual methodology described in Ford’s 10-K. When warranty costs rise, the accrual per vehicle rises, and that cost is ultimately passed through to consumers. Ford’s 3.5% claims rate translates to roughly $1,500–2,000 in warranty cost per vehicle at current average transaction prices. If claims rates continue rising, vehicles will get more expensive—not because of raw materials or labor, but because of quality failures.
2. EV Programs Will Face Heightened Scrutiny
The Bolt recall cost GM over $2 billion. EV battery packs represent 30–40% of vehicle cost. As EV production scales, the financial exposure from a single battery defect affecting hundreds of thousands of vehicles could be catastrophic. The NHTSA data showing EV-specific recalls growing from 12 to 74 in four years suggests this risk is not theoretical. Investors and boards will increasingly demand rigorous battery quality assurance before approving EV production ramp-ups.
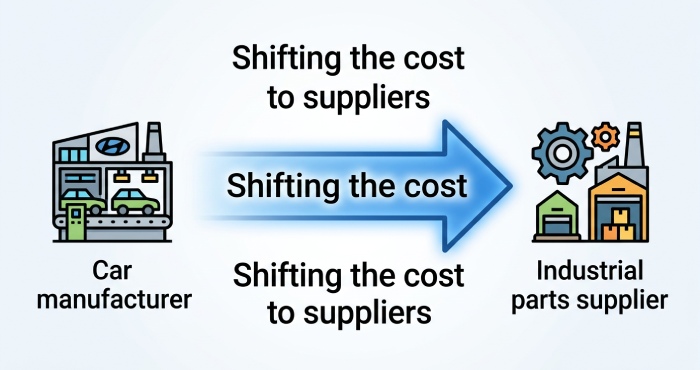
3. Supplier Relationships Are Being Restructured
GM recovered $1.9 billion from LG Energy Solution for the Bolt battery defect. That recovery signals a shift in how manufacturers allocate warranty risk to suppliers. Expect more aggressive contractual warranty pass-through provisions, expanded incoming quality inspection, and supplier consolidation toward fewer, more tightly controlled partners. The era of lowest-cost-wins supplier selection is giving way to a quality-first procurement philosophy—because a single bad supplier can now cost billions.

4. Legislative Pressure Will Intensify
California’s AB 1755 and SB 26 were direct responses to the explosion in lemon law litigation driven by warranty defects. As warranty costs rise and consumer complaints multiply, expect other states to strengthen their lemon law protections. Colorado has already reformed its law in 2024 (Colorado AG Public Advisory), and consumer advocacy groups are pushing for federal warranty reform. Manufacturers that do not reduce defect rates will face an increasingly hostile regulatory environment.
5. Quality Will Become a Competitive Moat
The CALPIRG data showing Toyota at 1 lemon lawsuit per 2,029 vehicles versus GM at 1 per 78 illustrates the magnitude of the quality gap. Manufacturers with lower warranty costs—Toyota, Honda, Subaru—enjoy a structural cost advantage that flows directly to margins, pricing flexibility, and customer retention. As warranty costs rise for the Big Three, the competitive gap with quality leaders will widen. Quality is no longer just a brand attribute; it is a quantifiable financial advantage worth billions. For consumers dealing with recurring vehicle defects, consulting a San Diego lemon lawyer can help them understand their rights under California Lemon Law and pursue compensation or a vehicle buyback when manufacturers fail to resolve persistent issues.
What to Watch: Metrics That Signal Change
For investors, analysts, and industry observers tracking this trend, these are the key metrics to monitor:
- Warranty claims rate (claims/revenue): Ford’s 3.5% is the benchmark for “too high.” Watch for whether this declines or whether GM’s rate converges upward.
- Changes of estimate: This is the adjustment manufacturers make when actual claims exceed their original accrual. Large positive changes of estimate signal that quality is deteriorating faster than expected.
- EV-specific recall volume: The NHTSA’s annual report tracks this separately. The 12-to-74 trajectory over four years is the trend to follow.
- California lemon law filings: Published in the AB 1755 legislative analyses and court statistics. If filings exceed 35,000 in 2025 (as some project), the litigation cost burden is intensifying.
- Stellantis’s warranty-linked compensation metrics: The Remuneration Report’s disclosure of warranty targets and payouts is a unique window into how seriously one manufacturer is treating quality at the board level.
- Ford’s Q/Q claims trend: Watch for the quarter when claims decline rather than plateau. Lawler’s “I can’t tell you when” makes this the most-watched inflection point in the industry.
The Bottom Line
The auto industry has a $20 billion quality problem, and it is getting worse. Ford, GM, and Tesla alone spent $11.75 billion on warranty claims in 2024—a 17% increase from the year before. Stellantis lost its CEO, missed its profit targets by 70%, and tied warranty performance directly to executive compensation that ended up paying out zero. California’s courts are processing tens of thousands of lemon law cases per year, nearly one in ten civil filings in Los Angeles County. And 31% of recalled vehicles never get fixed at all.
These are not growing pains. They are structural failures in design, manufacturing, and supplier quality control that are costing the industry billions in direct warranty claims, billions more in downstream litigation, and untold amounts in lost customer loyalty and brand erosion.
The manufacturers that solve this problem will own the next decade. The ones that don’t will keep writing ever-larger checks—to warranty repair shops, to consumer attorneys, to regulators, and eventually to the market, when investors decide that a company’s warranty line item tells them everything they need to know about its future.
For consumers facing repeated vehicle defects, consulting a lemon law attorney in San Diego can be an important step toward understanding their legal rights and pursuing compensation.
Sources and References
All sources are SEC filings, government PDFs, or published analyses of SEC warranty disclosures. Every URL links to a primary-source document.
SEC Filings
[1] Ford Motor Company. 2024 Annual Report on Form 10-K, Filed February 2025. https://s205.q4cdn.com/882619693/files/doc_financials/2024/ar/Ford-2024-Annual-Report.pdf
[2] Tesla, Inc.. 2024 Annual Report on Form 10-K, Filed January 2025. https://ir.tesla.com/_flysystem/s3/sec/000162828025003063/tsla-20241231-gen.pdf
[3] General Motors Company. Form 10-Q, Q1 2024, Filed April 2024. https://investor.gm.com/static-files/41c480cf-888b-4c0a-8d66-d83353444de8
[4] Stellantis N.V.. 2024 Annual Report, Published February 2025. https://www.stellantis.com/content/dam/stellantis-corporate/investors/financial-reports/Stellantis-NV-20241231-Annual-Report.pdf
[5] Stellantis N.V.. 2024 Remuneration Report, Published for 2025 AGM. https://www.stellantis.com/content/dam/stellantis-corporate/investors/stock-and-shareholder-info/shareholder-meetings/agm-2025/Stellantis-Remuneration-Report.pdf
[6] Stellantis N.V.. FY2024 Results Presentation. https://www.stellantis.com/content/dam/stellantis-corporate/investors/events-and-presentations/presentations/Stellantis-FY2024-Results-Presentation.pdf
Government PDFs
[7] NHTSA. 2024 Annual Report on Safety Recalls, Published April 2025. https://www.nhtsa.gov/sites/nhtsa.gov/files/2025-04/2024-annual-recalls-report.pdf
[8] NHTSA. January 2025 Report on Vehicle Safety Recall Completion Rates. https://www.nhtsa.gov/sites/nhtsa.gov/files/2025-01/recall-completion-rates-report-update-01172025.pdf
[9] California Assembly Judiciary Committee. AB 1755 Legislative Analysis, August 2024. https://ajud.assembly.ca.gov/system/files/2024-08/ab-1755-analysis.pdf
[10] Colorado Attorney General. Lemon Law Public Advisory, August 2024. https://coag.gov/app/uploads/2024/08/Public-Advisory-Lemon-Law-8-6-2024.pdf
Industry Analysis (SEC Data-Based)
[11] Warranty Week. 2024 U.S. Auto Warranty Annual Report, Published February 27, 2025. https://www.warrantyweek.com/archive/ww20250227.html
[12] Warranty Week. Mid-Year 2024 U.S. Auto Warranty Report, Published August 29, 2024. https://www.warrantyweek.com/archive/ww20240829.html
[13] WardsAuto. Warranty Spend Weighs on Ford’s Q3 Profit, October 30, 2024. https://www.wardsauto.com/news/archive-auto-ford-warranty-costs-impact-q3-2024/731382/
Nonprofit Research
[14] CALPIRG Education Fund / CARS Foundation / Frontier Group. The Auto Lemon Index, May 2022. https://publicinterestnetwork.org/wp-content/uploads/2022/05/Auto-Lemon-Index-CAP-CARS-FG-May22-1.pdf
Disclaimer: This article is provided for informational purposes only and does not constitute investment, financial, or legal advice. Financial data is derived from public SEC filings and published analyses of those filings. Past performance and financial disclosures do not guarantee future results. Consult a qualified financial advisor for investment decisions.