
Executive takeaway
Bowman & Brooke reportedly counted 32,480 California lemon law filings in 2025, followed by 13,295 in first-half 2026. The latter represents a reported 31.3% decline against the same period in 2025. This tracker provides the clearest recent comparison, not an independently verified statewide census. Earlier totals remain unresolved, and some reporting mixes years, jurisdictions, or legal categories. Fewer lawsuits do not establish fewer defective vehicles or prove reform succeeded. Legal professionals should preserve each figure’s source, scope, period, and status—and distinguish filing volume from consumer outcomes.
Why California Has More Than One Lemon Law Case Count
Filing statistics can distort litigation planning when their years, jurisdictions, or counting methods do not match. California lemon law reporting presents precisely this problem:
several plausible totals circulate without enough methodological detail to reconcile them.
This article audits supplied reporting; it does not independently count court records. It asks which figures support meaningful comparisons and which require qualification. Different annual totals are not inherently conflicting estimates, and repeated publication does not necessarily provide independent confirmation.
The overview separates three reporting streams by period. These are publication streams, not necessarily independent trackers.
| Reporting stream | Period identified | Reported California lemon law filings |
| Judicial Hellholes | 2023 | 22,265 |
| CalMatters | 2023 | More than 22,000 |
| Los Angeles Times, reporting Bowman &
Brooke’s figures |
2024; 2025; first half of 2026 | 30,142; 32,480; 13,295,
respectively |
The supplied evidence also attributes 22,655 filings in 2023 to an Assembly Judiciary Committee analysis. That exceeds the Judicial Hellholes figure by 390 filings. CalMatters’ rounded description accommodates either total and therefore cannot resolve the discrepancy.
The 2024 reporting presents a different problem. Roughly 22,000-plus, “exceeded 25,000,” and a reported finalized count of 30,142 do not necessarily represent equivalent statistical claims. Some wording supplies only a lower bound, while other wording suggests an estimate or exact count.
Bowman & Brooke’s reporting offers the clearest recent within-tracker comparison. The Los Angeles Times account describes a 2025 record and a 31.3% year-over-year decline during first-half 2026. That decline compares matching half-year periods, not six months against an entire year.
Even a consistent filing series has limits. It does not automatically count distinct consumers, defective vehicles, successful claims, or completed buybacks. The analysis therefore separates two questions: how many lawsuits reportedly reached court, and what those counts reveal about consumer protection.
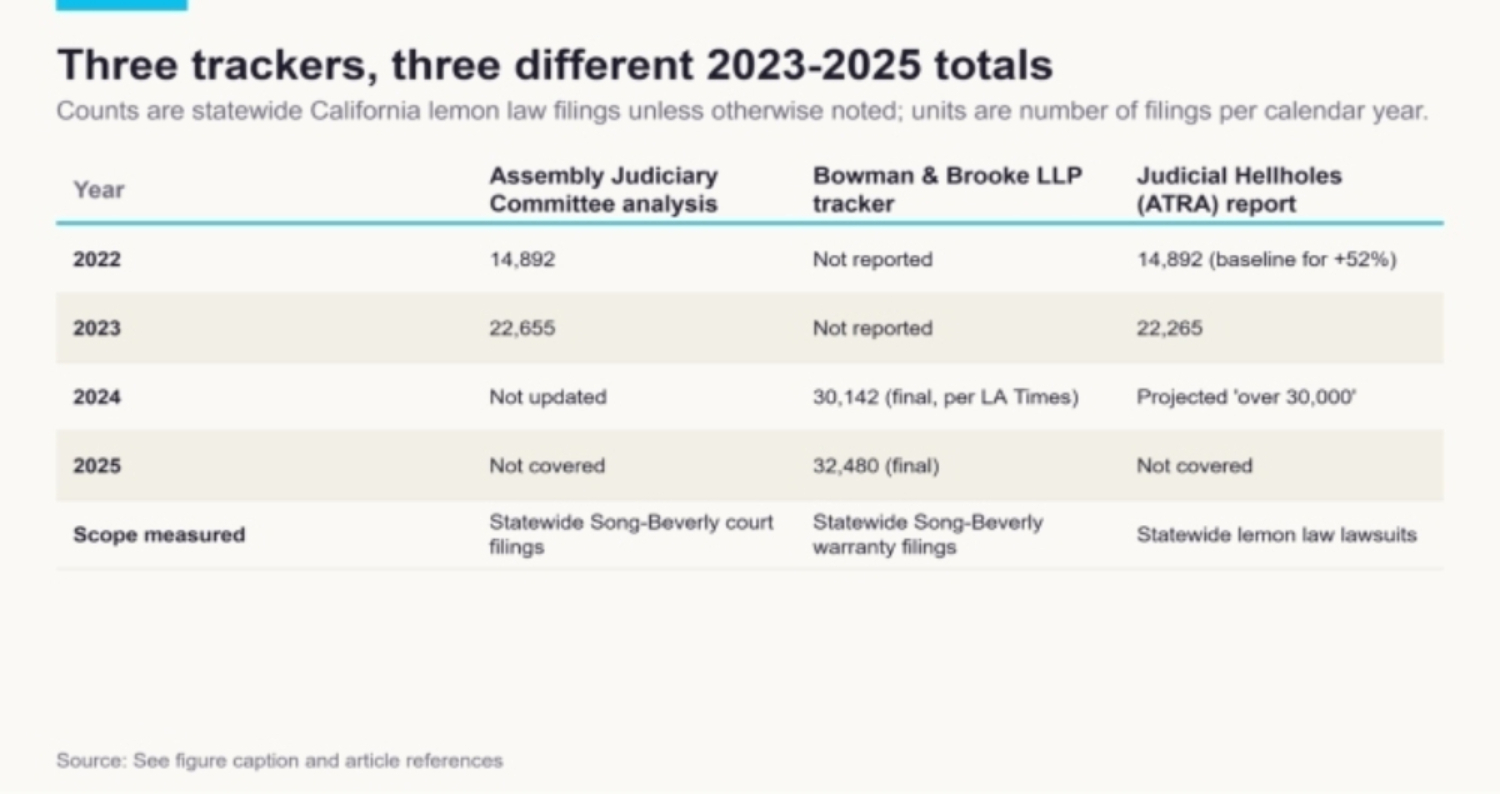
Side-by-side filing totals from the three most-cited trackers in the supplied evidence show agreement on 2022 but growing divergence from 2023 onward. Method: Compiled directly from figures attributed to the California Assembly Judiciary Committee’s AB 1755 analysis, Bowman & Brooke LLP’s litigation tracker (as reported by the Los Angeles Times), and the Judicial Hellholes report. Cells marked ‘Not reported’ indicate the supplied evidence contains no figure from that tracker for that year.
The 2023 Number That Changed as It Traveled
The widely repeated 2023 total of 22,655 has a recognizable attribution trail, but not independent verification here. A settlement-data review traces it to an Assembly Judiciary Committee analysis of AB 1755 dated August 30, 2024. The committee’s original text is unavailable in the supplied evidence.
For historical comparison, Advocate Magazine’s reform retrospective pairs that 2023 total with 14,892 filings in 2022. Multiple publications repeat these figures, but the evidence does not establish separate counting exercises. Their agreement may reflect a shared source rather than corroborating datasets.
CalMatters describes 2023 filings as “more than 22,000.” That wording is consistent with 22,655, but also with the competing exact total. Its lower precision prevents it from adjudicating between them.
The American Tort Reform Association’s Judicial Hellholes report gives 22,265 filings for 2023 and describes a 52% increase over 2022. The two exact totals differ by 390 cases, approximately 1.7% of 22,655. Those differences are calculations from the reported counts, not separate research findings.
The shared growth claim exposes an arithmetic inconsistency. Using the supplied 2022 baseline of 14,892, growth to 22,655 is approximately 52.1%. Growth to 22,265 is approximately 49.5%. Only the former rounds to 52% using standard whole-percentage rounding, a useful distinction when consulting a lemon law attorney San Diego for guidance on consumer protection claims.
This calculation does not establish which count is correct. The supplied evidence lacks collection dates and court-by-court methods sufficient to reconcile them. Different extraction dates, coverage, or counting rules remain possible explanations, not established findings. Institutional attribution and frequency of repetition cannot replace those missing details.
A later release raises a potentially larger problem: the years appear to shift. A December 2025 press release syndicated through National Law Review says filings “rose from approximately 15,000 in 2023 to more than 22,000 in 2024.” Those rounded quantities resemble the earlier figures attributed to 2022 and 2023, respectively.
This is an apparent one-year shift, not a proven editorial error. The evidence does not establish whether the release copied earlier figures, used another dataset, or mislabeled years. Nevertheless, moving quantities between years changes the apparent trend and could distort assessments of post-2024 reform. The unresolved dates should remain visible rather than disappear into a seamless annual series.
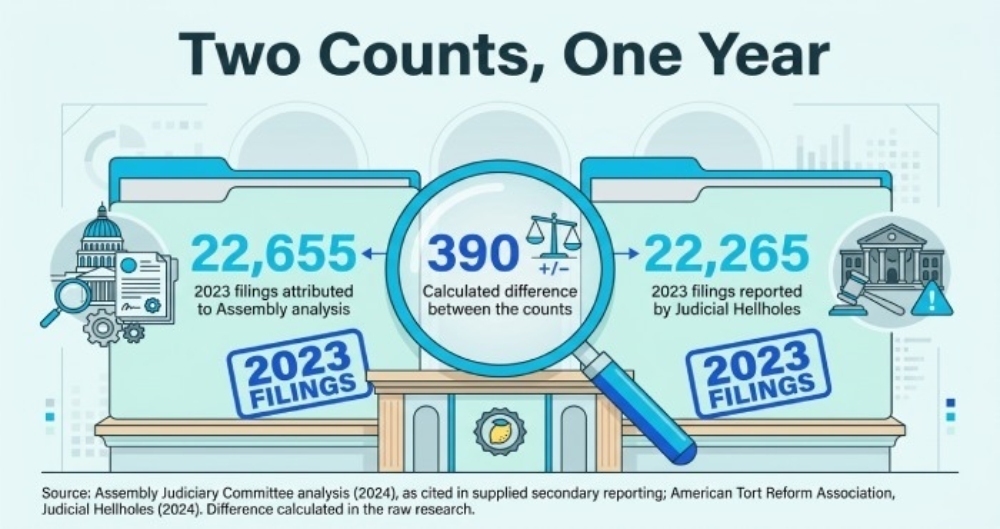
Source: Assembly Judiciary Committee analysis (2024), as cited in supplied secondary reporting; American Tort Reform Association, Judicial Hellholes (2024). Difference calculated in the raw research.
Why the 2024 Estimates Range From 22,000 to 30,142
The 2024 figures differ in both magnitude and statistical meaning. An approximate total, a lower bound, and a reported exact count cannot be treated as equivalent estimates.
- Roughly 22,000-plus: The supplied summary attributes this description to Advocate Magazine/EIN Presswire reporting through a reform retrospective. Its provenance is less clear than the tracker figures.
- “Exceeded 25,000”: A threshold attributed to Bowman & Brooke in McMillan Law Group reporting published during May–June 2026.
- 30,142: A count reported as finalized and attributed to Bowman & Brooke in the October 2026 Los Angeles Times account.
“Exceeded 25,000” does not contradict 30,142. It sets no upper limit. The same caution applies to wording such as “more than 22,000”: a threshold alone cannot establish an undercount. Only a description intended as an approximate total creates a substantial numerical disagreement
Using 22,000 as an illustrative comparison point, 30,142 is 8,142 filings higher—approximately 37% above it. Because the smaller figure is approximate and ambiguously presented, this calculation describes scale, not a verified counting discrepancy.
Publication timing does not explain the difference by itself. The May–June 2026 reports preceded the October account, but publication dates are not data cutoffs. Different collection dates, revisions, coverage, or reporting errors could explain the gap. The supplied evidence does not establish any of them.
Likewise, “reported as finalized” describes the presentation of 30,142, not an independent verification of its completeness.Without consistent collection methods, readers cannot determine whether earlier descriptions relied on the same underlying population, making guidance from a California lemon law lawyer valuable for understanding relevant legal standards and consumer protections.
A separate projection explains why figures above 30,000 circulated during 2024. The December 2024 Judicial Hellholes report said plaintiffs’ firms were “on pace for filing over 30,000 claims in 2024.” That was a projection from partial-year information, not an observed annual total.
The later count of 30,142 is consistent with that threshold, but no precise forecasting error can be calculated. Comparability also depends on whether the report’s “claims” and the tracker’s “filings” represent the same counting unit.
Finally, comparing the committee-attributed 22,655 for 2023 with 30,142 for 2024 yields approximately 33.0% growth. This is a mixed-source calculation, not a verified change within one dataset. It suggests substantial growth only if legal categories, geographic coverage, and counting rules are sufficiently compatible.
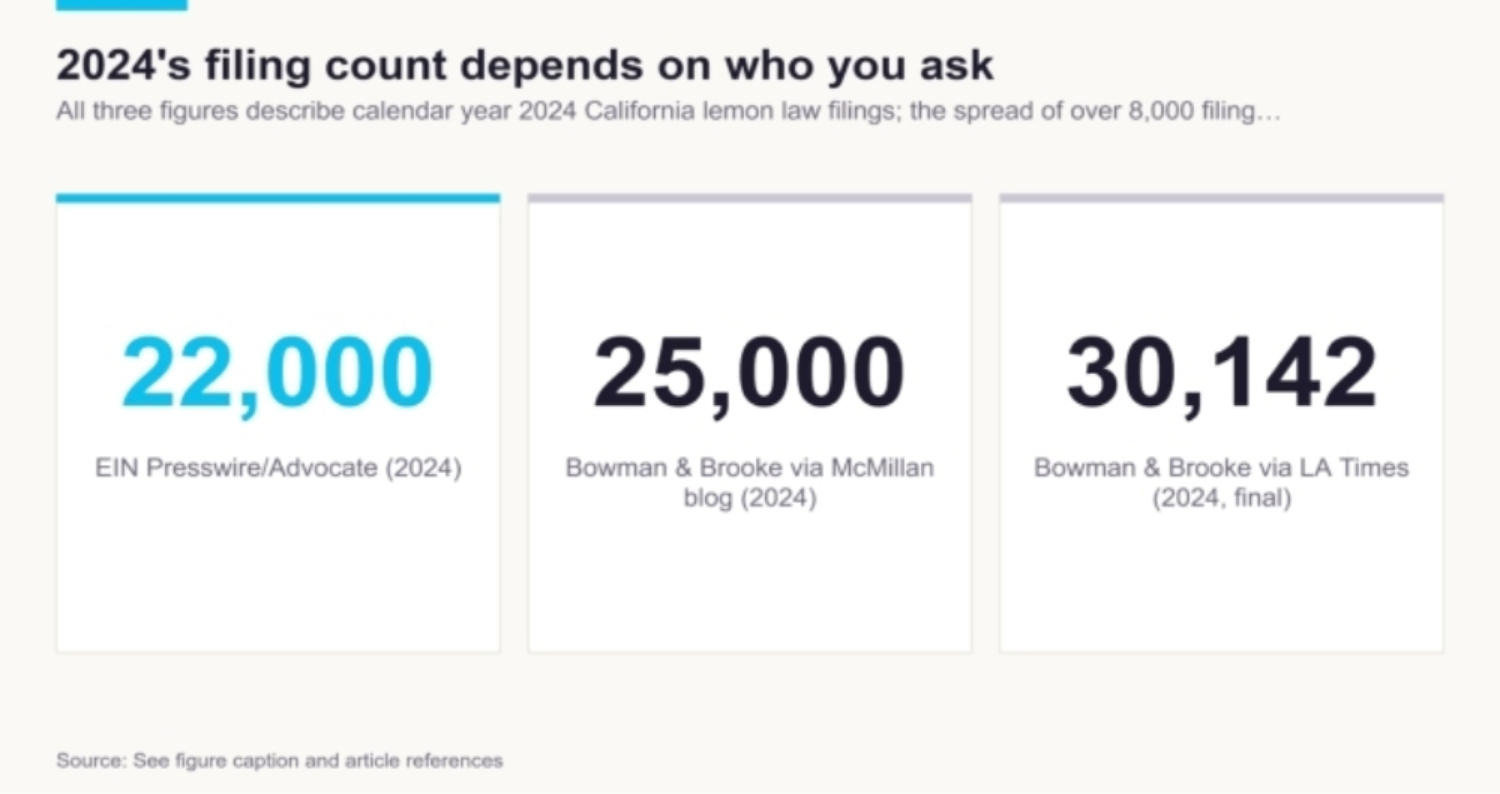
Three sources describe the same calendar year, 2024, with totals ranging from roughly 22,000 to over 30,000 filings. Method: Each value is the headline 2024 figure reported by a distinct secondary source: an Advocate Magazine/EIN Presswire review, a McMillan Law Group blog citation of Bowman & Brooke dated mid-2026, and Bowman & Brooke’s finalized figure as reported by the Los Angeles Times in October 2026.
What the 2025 Peak Actually Establishes
The strongest available annual comparison shows reported filings increasing 7.8% in 2025. Bowman & Brooke counted 30,142 filings in 2024 and 32,480 in 2025, according to the Los Angeles Times. This provides a same-tracker comparison, although the supplied evidence does not independently verify its methods.
The calculation is straightforward: 32,480 minus 30,142 equals 2,338 additional filings. Dividing that increase by the 2024 total gives approximately 7.8% annual growth. The tracker described 2025 as a record year.
A competing claim that filings “surpassed 35,000 by 2025” lacks comparable support. A McMillan Law Group post attributes it to “CA Lemon Law Guys.” The supplied evidence provides no methodology, measurement date, or traceable primary source. “By 2025” also leaves the observation period unclear.
The larger estimate therefore remains unverified, not disproved. Different coverage or periods might explain it, but neither explanation is established. It should not become an alternative annual benchmark merely because another publication repeats it.
The peak-and-drop figure discussion must distinguish observations from projections:
- 2024 annual total: 30,142 reported filings.
- 2025 annual total: 32,480 reported filings, the tracker’s record.
- First half of 2026: 13,295 reported filings, down 31.3% against first-half 2025.
- 2026 projected annual pace: Approximately 26,500 filings, not a completed annual count.
A figure should visibly distinguish the half-year observation and annual projection from completed calendar years. Comparing 32,480 with approximately 26,500 illustrates a projected direction, not a finalized annual decline.
Claims about slowing growth require another qualification. The earlier roughly 33% increase combines the committee-attributed 2023 total with Bowman & Brooke’s 2024 count. The 7.8% calculation does not mix producers. Their numerical difference therefore cannot establish a fully comparable growth trajectory or its relationship to reform implementation.
The supported conclusion is narrower: this tracker reported a 2025 peak followed by a substantial early-2026 decline. Whether that decline reflects better dispute resolution requires evidence beyond filing counts.
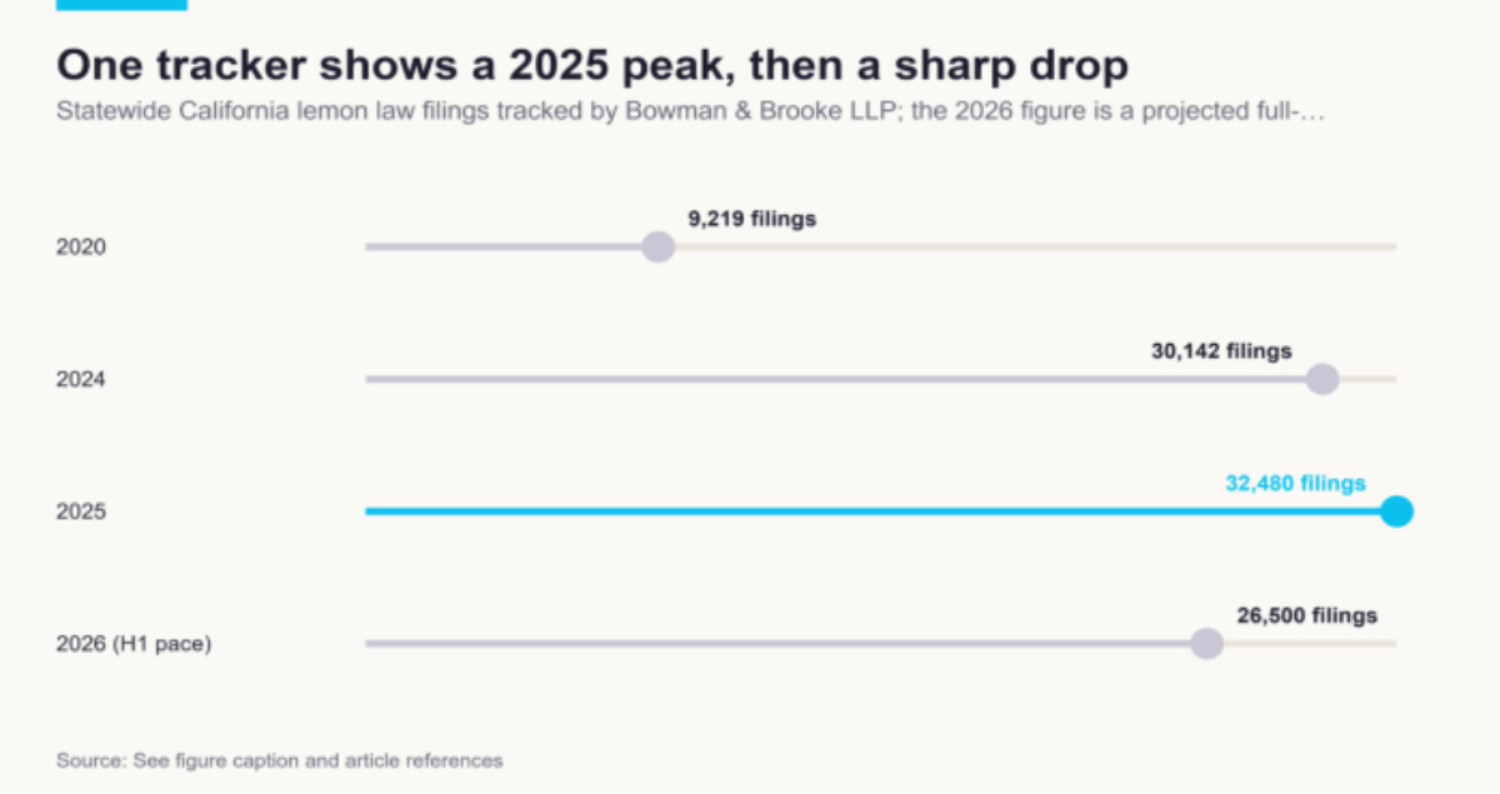
Bowman & Brooke’s statewide filing count rose steadily from 2020 through a 2025 peak before the first half of 2026 pointed to a lower annual pace. Method: Plots the only multi-year filing series from a single, named tracker in the supplied evidence: Bowman & Brooke LLP, as reported by the Los Angeles Times. The 2026 value is the tracker’s own full-year pace projection based on first-half data, not a finalized count; 2021 to 2023 are not reported by this tracker in the supplied evidence.
Fewer Filings Do Not Prove Reform Worked
Bowman & Brooke reportedly counted 13,295 filings in first-half 2026, down 31.3% year over year. The Los Angeles Times report compares that period with first-half 2025. This establishes a reported decrease within the tracker, not proof that reform improved consumer outcomes.
The California Courts newsroom item describes the same broad decline. Such repetition does not necessarily establish independent confirmation: several publications may rely on one underlying count.
The key distinction is between fewer lawsuits and fewer unresolved vehicle defects. McMillan Law Group’s commentary supports the narrower interpretation that fewer lawsuits reportedly reached court. Filing totals cannot establish faster repairs, better settlements, or improved access to relief.
Procedural changes offer possible explanations, but the evidence does not isolate their effects. Ginsburg Law Group’s analysis describes SB 26 as making AB 1755’s pre-suit notice and mediation procedures optional for manufacturers. It also summarizes filing limits as generally one year after warranty expiration and six years after delivery. These are commentary summaries, not independently verified rules for every claim; their application requires statutory verification.
Several mechanisms could reduce filings without demonstrating better consumer outcomes. Pre-suit procedures might resolve disputes before litigation, while deadlines might shift filings between periods. Manufacturer participation and lawyers’ strategies could also affect timing. These remain hypotheses, not measured contributions to the decline.
Attributing the change specifically to AB 1755 would require separating its effects from SB 26 and other influences. The supplied evidence contains no causal comparison capable of doing so.
Annualizing the half-year count introduces a separate assumption. Multiplying 13,295 by two yields 26,590, broadly matching the reported pace of more than 26,500. This calculation assumes the second half resembles the first. The supplied evidence does not test seasonal patterns or deadline-related filing surges, so doubling is not a validated forecast.
Firm-level comparisons require especially prominent period labels. The reported counts compare full-year 2025 with first-half 2026:
| Firm | Full-year 2025 | First-half 2026 |
| Strategic Legal Practices | 6,433 | 108 |
| Quill & Arrow LLP | 6,052 | 2,029 |
| MFS Legal | 1,657 | 1,582 |
| Sina Rez Law | 702 | 650 |
Calling MFS Legal or Sina Rez Law “nearly flat” would conceal the unequal periods. Their six-month totals approached their previous twelve-month totals; that does not measure stable annual activity. Nor should those counts automatically be doubled into firm-level forecasts.
The much smaller totals for Strategic Legal Practices and Quill & Arrow warrant investigation, not immediate causal attribution. Without first-half 2025 counts, these comparisons cannot quantify each firm’s contribution to the statewide year-over-year decline. They also cannot identify whether strategy, timing, client demand, or another factor explains the differences.
Reform evaluation must examine what happened to the underlying disputes. Consistently measured filings should be paired with resolution times, recoveries, and evidence about disputes resolved—or left unresolved—outside court.
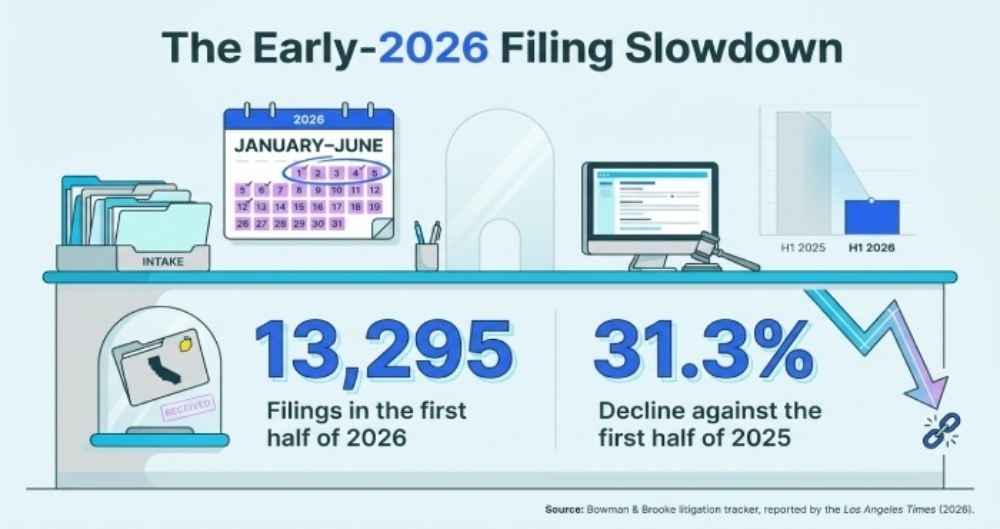
Source: Bowman & Brooke litigation tracker, reported by the Los Angeles Times (2026).
Los Angeles Shows Court Pressure, Not a Statewide Total
Los Angeles provides local court context, not a substitute for statewide filing totals. Two reported figures describe different dimensions of its caseload: a lemon law share and a broader product liability count.
The California Judges Association estimates that nearly 10% of Los Angeles County Superior Court civil filings involve lemon law disputes. The estimate appears in CalMatters’ reporting, but its precise reference period is unclear in the supplied evidence. It should not be presented as a newly measured 2026 share.
The denominator is the court’s civil filings, not statewide filings or vehicle sales. Without the corresponding total and period, the percentage cannot establish an absolute county count.
A separate statistic has an explicit year but covers a broader category. The Center Square’s account of Lex Machina’s 2026 report reports 11,822 product liability cases in Los Angeles County Superior Court during 2025. That category includes vehicle warranty disputes but is not limited to them. The supplied evidence does not identify its lemon law subset.
Three distinctions prevent substituting these figures for one another:
- Geography: Both concern Los Angeles County Superior Court, not all California courts.
- Legal category: The percentage concerns lemon law disputes; the count covers broader product liability litigation.
- Measurement: Nearly 10% is an approximate share with an unclear reference period; 11,822 is a reported category count for 2025.
Dividing 11,822 by 10% would therefore not recover total civil filings. The numerator covers the wrong category, and the periods may differ. Applying the county share statewide would likewise assume an unsupported geographic pattern.
Nor should county counts be added to statewide totals. Overlapping cases would be counted twice, while category differences would remain unresolved.
These figures support concern about local court pressure associated with lemon law litigation. They do not establish statewide volume, a current docket share, or the workload required by each case.
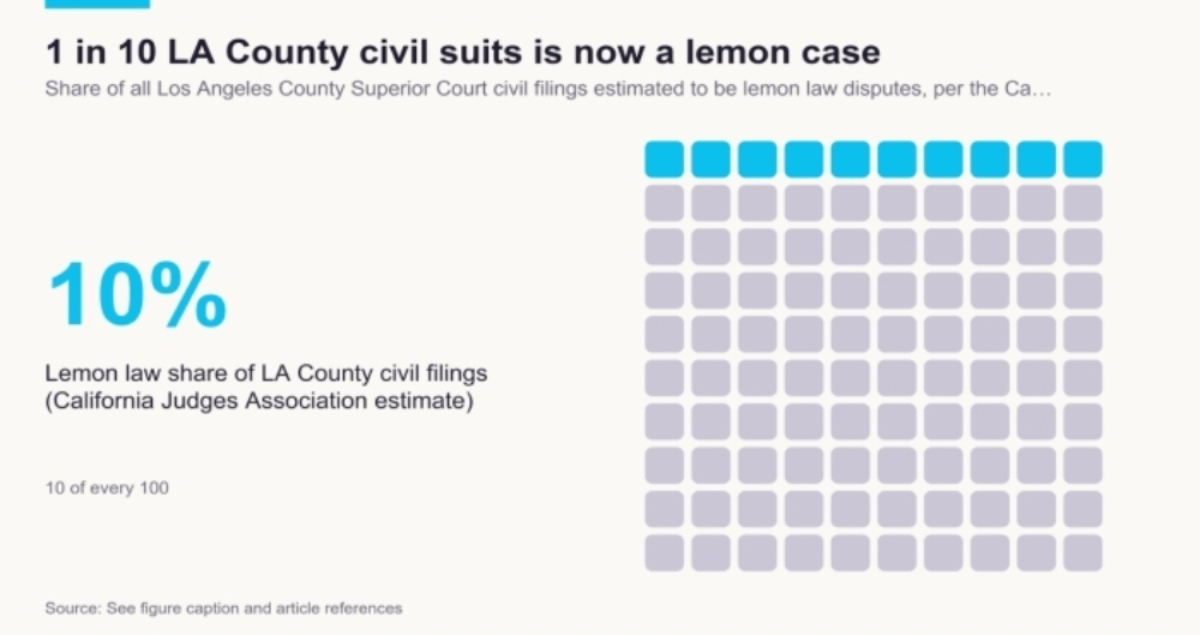
An estimate from the California Judges Association suggests lemon law disputes now make up a meaningful share of Los Angeles County’s civil docket. Method: Visualizes the California Judges Association’s estimate, repeated across several secondary sources, that nearly 10% of all civil filings in Los Angeles County Superior Court involve lemon law disputes.
Recoveries, Buybacks, and Claims Measure Different Things
Filings, claims, resolutions, buybacks, and recoveries measure different events or outcomes. Conflating them can turn a firm’s reported results into a misleading statement about statewide litigation.
A filing counts a court proceeding initiated within a specified period. A claim describes an asserted demand or entitlement and need not represent a separate lawsuit. A resolution records a concluded matter; a completed buyback records a vehicle repurchase. Recovery figures measure dollars under the reporting source’s definition.
Timing separates these measures even when they concern the same disputes. Matters resolved this year may have been filed earlier. Annual comparisons therefore require a consistent event definition and observation period, with guidance from an RV lemon law attorney to help interpret relevant legal trends.
Firm announcements illustrate the distinction but are not statewide outcome studies. Wirtz Law’s announcement publicizes a $70 million client-recovery milestone. That attributed figure does not establish California’s total recoveries or the firm’s share of them.
The Lemon Reps’ announcement reports more than $3.2 million recovered during its first 12 months and over 1,500 resolved cases. These are promotional, firm-reported results—not independently verified statewide outcomes or a basis for ranking firms.
Meaningful recovery comparisons require three definitions:
- Period: Calendar year, first year of operation, or cumulative results?
- Population: Which clients, matters, jurisdictions, and eligibility criteria are included?
- Components: Does recovery mean gross settlement value, client payments, or another measure? How are fees, costs, loan balances, and noncash relief treated?
These questions do not imply that either announcement used a particular accounting method. They identify information needed before larger totals can support claims of better performance. Dividing aggregate recoveries by resolved matters is also unsafe unless both quantities cover the same population.
Aggregator percentages require similar scrutiny. Zipdo reports that 3.2% of new vehicle registrations nationally result in claims. For historical comparison, it also presents a 12% California figure for 2022. Neither percentage is traceable to a named underlying study in the supplied evidence.
The percentages are not inherently contradictory: California’s rate could differ from the national rate. An implied claim count exceeding lawsuit filings would not itself prove an error, because claims and lawsuits need not match.
The decisive problem is missing verification. Until the study, denominator, period, and claim definition are established, these figures should stay out of client-facing materials. Plausibility checks identify questions; they do not replace evidence.
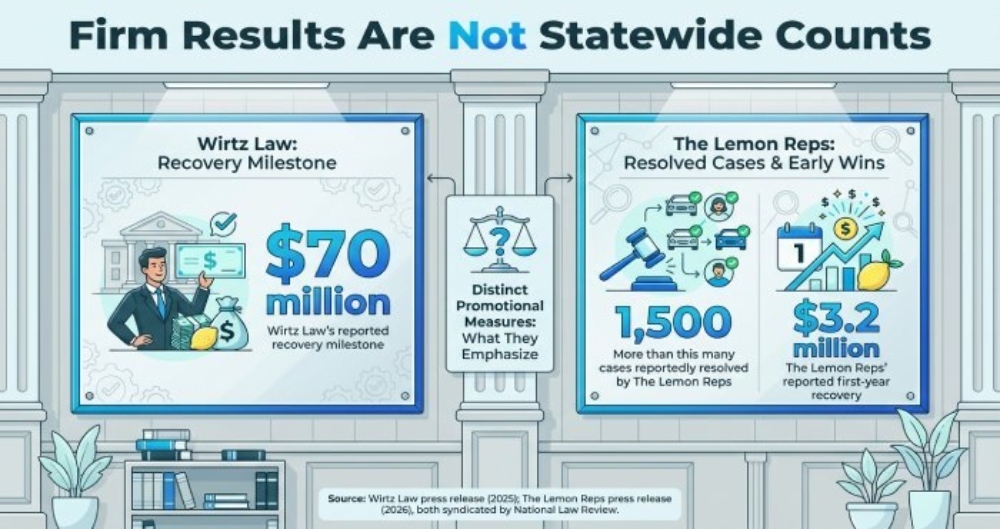
Source: Wirtz Law press release (2025); The Lemon Reps press release (2026), both syndicated by National Law Review.
Five Checks Before You Use a Filing Statistic
A usable filing statistic carries its scope and limitations with it. Apply five checks before using one in a brief, presentation, intake forecast, or public comment.
- Identify the producer and publication chain.
Separate whoever counted the cases from whoever published or repeated the result. The Los Angeles Times account attributes its figures to Bowman & Brooke; preserve that attribution. Record publication dates, but do not mistake them for observation periods or data cutoffs. Several outlets repeating one source constitute one evidence chain, not independent confirmation. - Define the measured population.
Establish whether the number covers statewide filings, county caseloads, claims, buybacks, or firm resolutions. The Los Angeles product liability reporting cannot independently validate a statewide lemon law total. For intake planning, distinguish filed cases from prospective clients and demands submitted outside court. Do not substitute an available measure for a different, unavailable one. - Match observation periods.
Compare complete years with complete years, or matching portions of successive years. Keep observation dates separate from publication and extraction dates. The syndicated December 2025 release illustrates why this matters: its quantities resemble earlier figures but appear under later years. That resemblance warrants investigation, not a definitive accusation of copying or error. Exclude unreconciled periods from growth calculations. - Distinguish counts, thresholds, and projections.
Preserve wording such as “exceeded,” “approximately,” and “on pace for.” The Judicial Hellholes projection of more than 30,000 claims for 2024 was not a completed annual count. A later result consistent with that threshold does not retroactively change its status. Likewise, “finalized” describes a source’s designation; it does not independently establish complete court coverage. - Check arithmetic and evidential support.
Calculate growth using the earlier period as the denominator, after checking that the inputs are comparable. Trace attribution as far as the available evidence permits. If original records or methods are unavailable, state that limitation rather than implying verification. Different percentages may reflect different populations, not contradictions; numerical plausibility alone cannot validate or disprove them.
Keep a compact evidence note beside every approved figure. Record the producer, jurisdiction, case definition, observation period, data cutoff, publication date, status, and methodological caveats. Preserve original wording and republication chains for consequential comparisons. Where a material detail remains unknown, label it and narrow the claim.
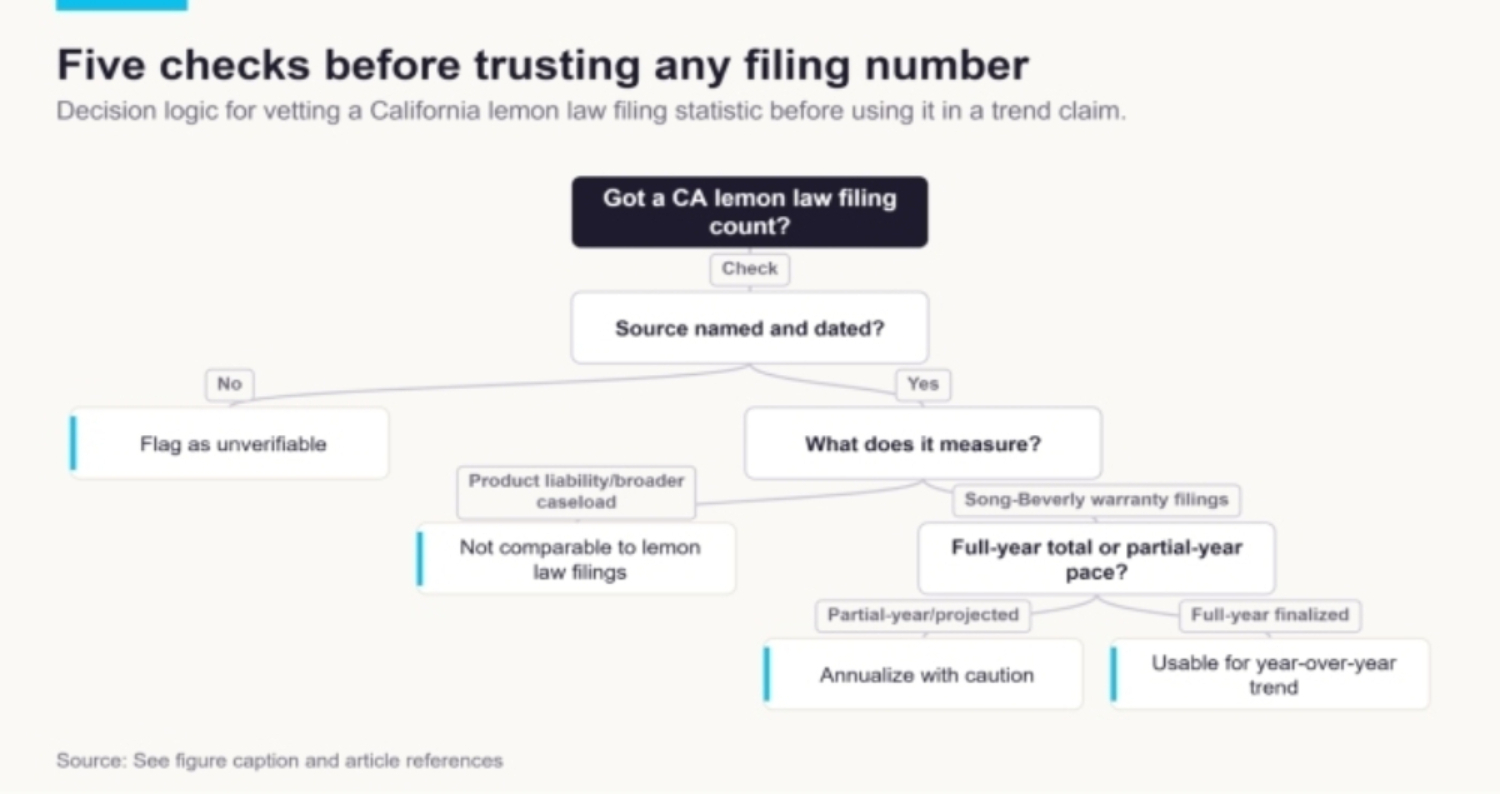
A practical audit path for readers to apply before citing any California lemon law statistic as evidence of a trend. Method: Derived from the specific discrepancies documented in this audit: unnamed sourcing, conflated measurement categories, and projections mistaken for final counts across the supplied evidence.
The Answer Legal Professionals Can Defend
The defensible answer is an attributed count, not an independently verified statewide census. Bowman & Brooke reportedly counted 32,480 California lemon law filings in full-year 2025 and 13,295 in first-half 2026, according to the Los Angeles Times. The reported 31.3% decline compares first-half 2026 with first-half 2025—not with the entire previous year.
This series supports a reported 2025 peak followed by a substantial early-2026 decline. It does not resolve competing earlier totals. In particular, uncertainty about the 2023 counts and the meaning of some 2024 descriptions prevents a precisely comparable annual series assembled across sources.
Stronger measurement requires consistent legal categories, geographic coverage, collection methods, and reporting periods. Applying one documented method from 2022 onward would help distinguish historical changes from classification or collection differences. Finalized 2026 data would also replace extrapolation with an observed annual total.
Even complete filing data would not, by itself, establish reform’s success. Fewer lawsuits could reflect earlier resolution, altered timing, or barriers to pursuing claims. The supplied evidence cannot distinguish those possibilities or isolate AB 1755’s effects from other procedural and strategic changes.
A consumer-focused evaluation should examine resolution times, compensation, buybacks, and access to effective remedies. It should determine whether disputes end before litigation or remain unresolved. These are research questions, not outcomes established by the reported decline.
Legal professionals can communicate the trend without overstating its precision or policy significance. State what each number measures before explaining what it means.
Limitations
- This audit relies on supplied source summaries, not underlying court records, complete source texts, or documented collection methods.
- The Assembly figures reach this audit through secondary sources. Repeated publication does not establish independent confirmation.
- The apparent one-year shift in a syndicated press release remains an inference, not a confirmed editorial error.
- First-half 2026 figures cannot establish full-year results. Available firm comparisons also mix annual and half-year periods.
- The evidence cannot isolate reform effects or establish changes in vehicle defects, access to remedies, or consumer recovery. Statutory descriptions require verification against applicable law.
References
- California lemon law filings fall sharply after record year
- California ‘Lemon Law’ Filings Fall Sharply After Record Year
- California Lemon Law Lawsuits Dropped 31%. That Doesn’ …
- California Lemon-Law Filings Reportedly Fell 31% In 2026. What Changed For Consumers?
- California Lemon Law fueling surge in Los Angeles car warranty…
- California’s Lemon Law Crisis: Which Car Brands Are Selling You …
- Average Lemon Law Settlement in California (2026)
- AB 1755 One Year Later: Did the Controversial Lemon …
- California lawmakers scramble to fix ‘lemon’ vehicle law
- California
- When life gives you lemon…law reform – Advocate Magazine
- California’s Lemon Law Filings Surge as New Data Shows …
- 100+ Lemon Law Statistics (2026, Fact-Checked) – zipdo.co
- Wirtz Law Lemon Law Attorneys Conclude Year With $70 …
- The Lemon Reps Recover Over $3.2 Million for …